Exploring the Suffolk Virginia Night Sky – Astronomy, Astrophotography, Telescopes, EAA – Planets and Stars and Nebula and Galaxies – Looking, Learning, Sharing… Let's see what we can see…
Here is the process I used to get fchart3 running on a Raspberry Pi 4 running Raspberry Pi OS (raspbian).
# Install the libcairo2 development dependency

# There may be other dependencies, but libcairo2-dev is the only one I was lacking

sudo apt install libcairo2-dev
# Make the directory path - this is what I use but you can tailor it to whatever
mkdir -p ~/Projects/fchart3/virtualenv/fchart3
# Set up the python virtual environment and activate it
cd ~/Projects/fchart3/virtualenv
chmod 775 fchart3
cd ..
python3 -m venv ./virtualenv/fchart3
source ./virtualenv/fchart3/bin/activate
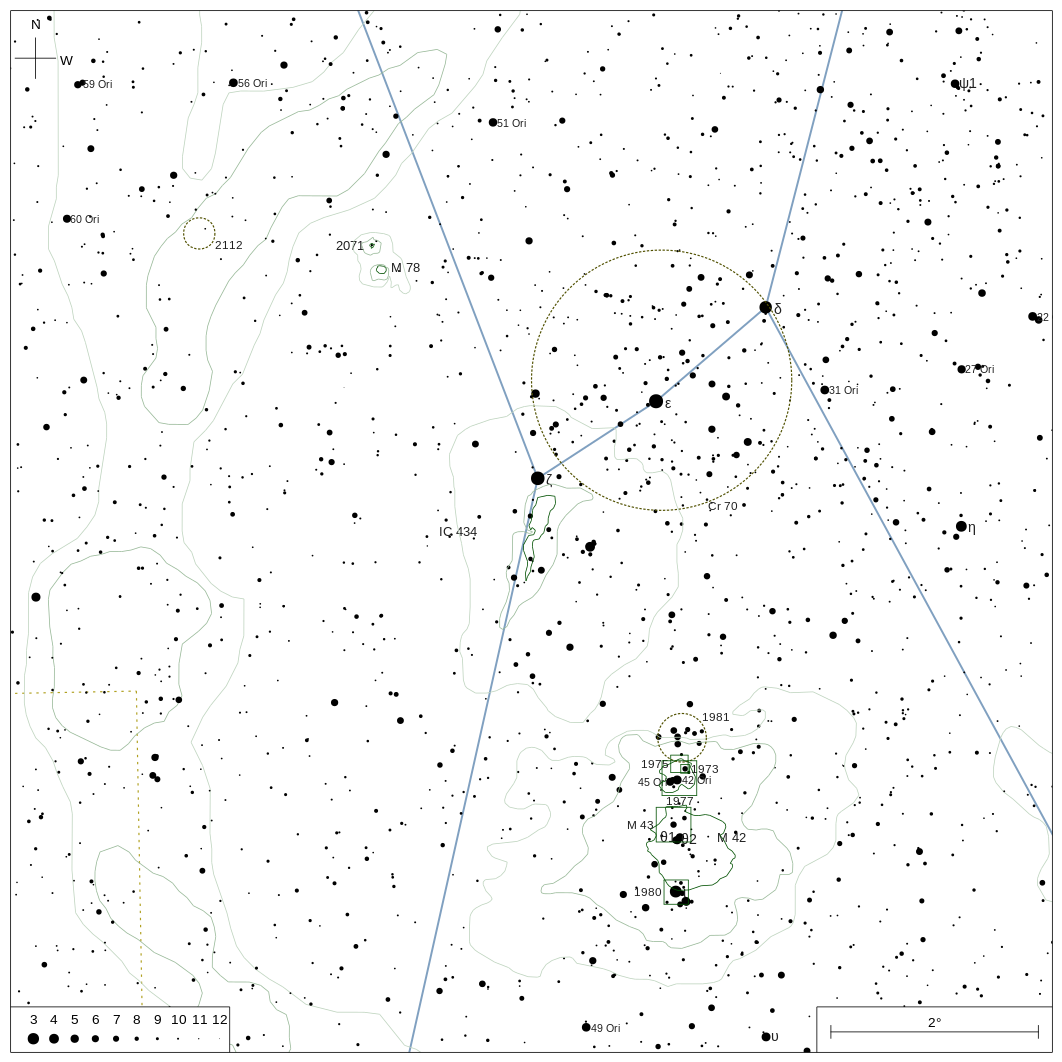
# Enjoy - This will create a chart of IC 434 - The Horsehead Nebula in Orion
fchart3 -limstar 12 -limdso 12 -fmessier --show-nebula-outlines -width 270 -height 270 -fieldsize 10 -f /var/www/raspastro/static/fchart3/IC434_w_chart.png IC434
IC 434 chart generated with fchart3 using the default coloring:
I did set a custom width and height and set show-nebula-outlines to draw the outlines of the nebula. By default the width is configured to 180 mm and the height is configured to 270 mm to fit on a 8 1/2″ x 11″ piece of paper. Images can also be exported directly to a PDF.
The program is highly configurable. There are a number of command line options which can also be passed via a configuration file. fchart3 –help will print out the options and if you used the method above to install then the default configuration file can be found here: ~/Projects/fchart3/virtualenv/fchart3/lib/python3.9/site-packages/fchart3/data/default.conf
Here is a chart I generated of the nova T CrB with fchart3 using a customized configuration file: T CrB is in the center of the Telrad overlay. I used a custom configuration file and the following CLI to generate the above skychart:
fchart3 -config /home/pi/Projects/fchart3/suffolksky.conf -fieldsize 20 -limstar 12 -limdso 8 --star-colors -telrad --output-file /var/www/raspastro/static/fchart3/TCrB.png "15:59:30.1622,+25:55:12.613,TCrB"
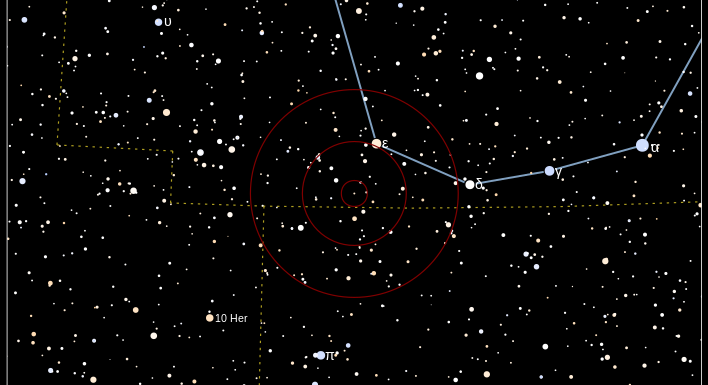
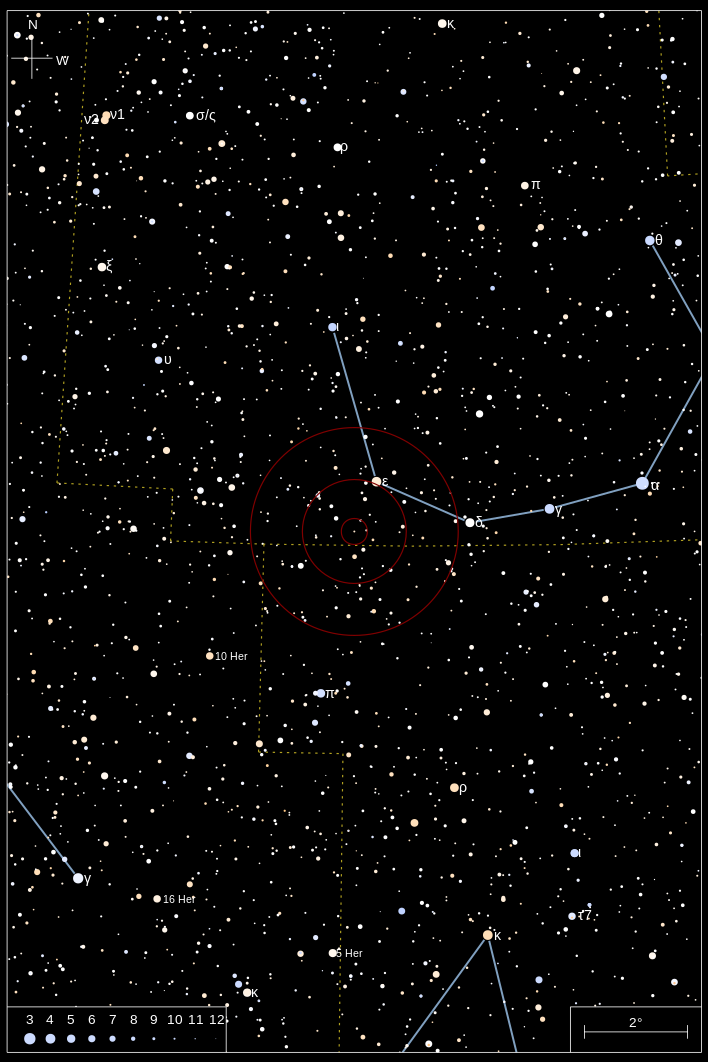 T CrB is in the center of the Telrad overlay. I used a custom configuration file and the following CLI to generate the above skychart:


